Bike Stores Analysis
In this project we analyze data about bike stores for the years 2016-2018.
We utilize SQL to extract, transform, clean and filter the data to make it more usable for analysis with the use of Joins.
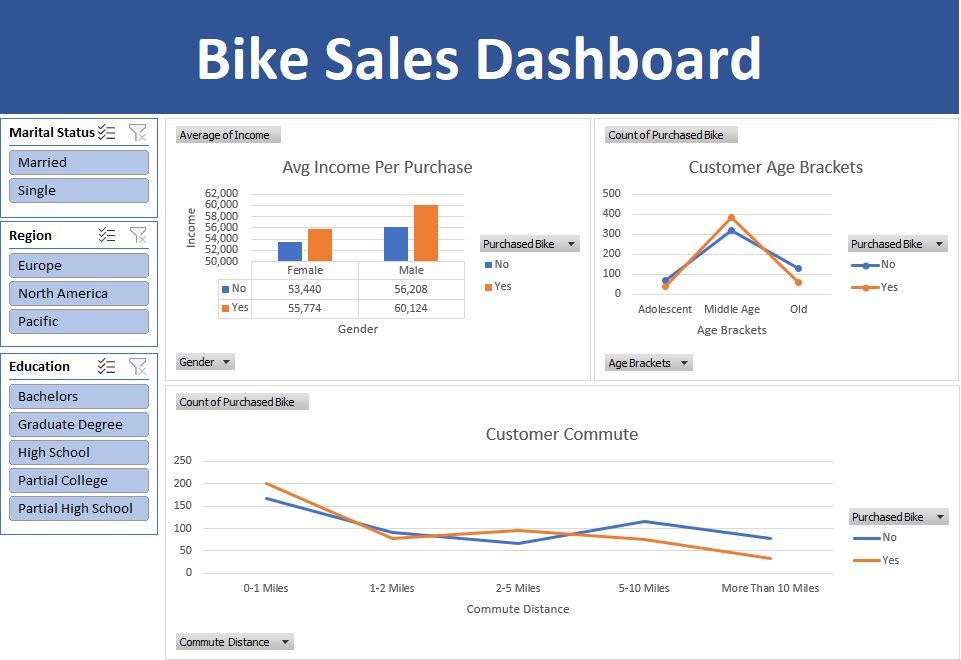
We analyze the data and create Pivot Tables and an interactive Dashboard in Excel.
We create an interactive Dashboard with slicers to indicate the company's progress in Tableau with the use of Filters, Parametres and Calculated Field.

To view the SQL Code click here.
To download the Excel File click here.
To view the Tableau Dashboard click here.